Chart of the Month: April
Last month, I promised to post at least one interesting chart every month. April has slipped by quickly! Here is a chart showing Vehicle Kilometers Traveled (VKT) by US Cars, Vans, SUVs, and pickups from 1970 to 2002 in billion kilometers per year. (1 kilometer ~ 0.62 miles)
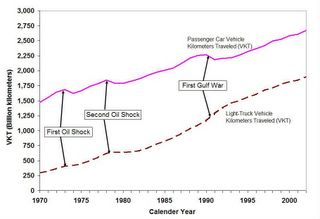
Click on chart for a larger view.
Notice that the light-truck travel has increased very rapidly. This will help explain, in part, why light-truck fuel consumption has grown so rapidly in the past thirty years. Also notice how shocks due to wars and embargos tend to moderate growth in vehicle travel. I do not have the data from 2003/2004, but in '03/'04 we are likely to see a less sharp decline in VKT because continued strong sales of the light-trucks.
So, at least one of the reasons for growth in light-duty vehicle fuel consumption is that vehicle travel is increasing. This, in spite, of todays vehicles getting 50% more in terms of fuel economy than their counterparts thirty years ago. Next time, I will post this improvment in individual vehicle fuel economy, but todays chart should make one thing clear. If we are to slow down the growth in fuel consumption, we may have to moderate the growth in vehicle travel as well.
P.S. The fact of the week has a complimentary chart up for the coming week: How the Price of Gasoline Relates to Vehicle Miles Traveled?
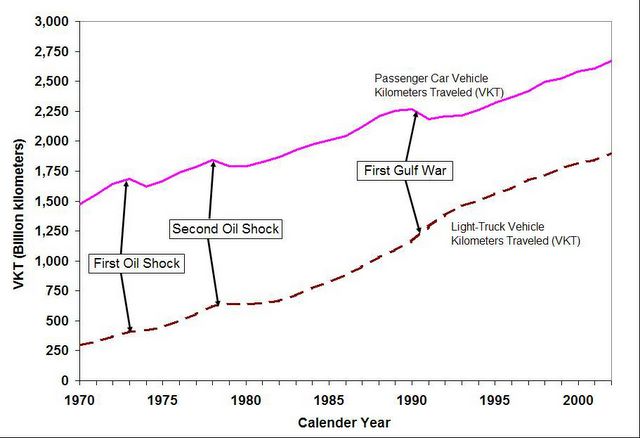
posted by APB at 7:09 PM
![]()


0 Comments:
Post a Comment
<< Home