Chart of the Month: June 2005
While posting last month's chart, I noted that
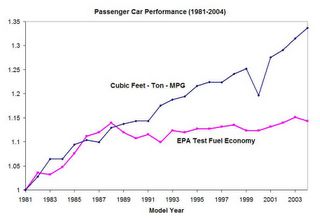
This first chart below shows normalized values of passenger car fuel economy and performance. The performance is measured as a multiplication of vehicle interior volume in cubic feet, inertia weight in tons and miles per gallon. The figure shows that while performance as measured here has increased by ~34%, the fuel economy has increased by only 14%.
 Click on the chart for a larger image.
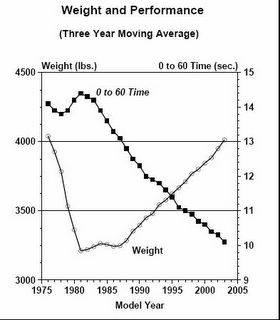
The second figure (courtsey of EPA) shows light-duty vehicle weight and accelartion between 1976 and 2004. Click on the chart for a larger image.
As you can see from the figure, vehicle accelation held steady and vehicle weight dropped during 1976-1985 period when CAFE standards went in to effect. After 1985, however, vehicle weight has increased steadily, and accelaration performance has improved as shown in reduction in 0-60 accelartion time.
How much exactly have the improvements in performance hurt the fuel economy? According to EPA estimates,
Thus, it is important to remember that fuel economy of today's vehicles is low at least in part because consumers (you and me) have demanded bigger, heavier, and faster vehicles. If we want to see better fuel economy, we may have to give up any further increase in performance, or even thinking about downsizing and/or downweighting our vehicles.
P.S.: Chart of the Month Archive is available on the right hand column.
... much of the technology improvements in the past 25 years have been used up in improving vehicle performance rather than fuel economy.The chart(s) for this month indicate where the improvment in efficiency has gone if it has not improved the fuel economy. You will often hear me say that Americans have been driving bigger, heavier and faster vehicles. So the charts that follow show how each one of these has increased over the last 25 years.
This first chart below shows normalized values of passenger car fuel economy and performance. The performance is measured as a multiplication of vehicle interior volume in cubic feet, inertia weight in tons and miles per gallon. The figure shows that while performance as measured here has increased by ~34%, the fuel economy has increased by only 14%.
 Click on the chart for a larger image.
The second figure (courtsey of EPA) shows light-duty vehicle weight and accelartion between 1976 and 2004.
 Click on the chart for a larger image.
As you can see from the figure, vehicle accelation held steady and vehicle weight dropped during 1976-1985 period when CAFE standards went in to effect. After 1985, however, vehicle weight has increased steadily, and accelaration performance has improved as shown in reduction in 0-60 accelartion time.
How much exactly have the improvements in performance hurt the fuel economy? According to EPA estimates,
...had the new 2003 light vehicle fleet had the same average performance and same distribution of weight as in 1981, it could have achieved about 33 percent higher fuel economy.
Thus, it is important to remember that fuel economy of today's vehicles is low at least in part because consumers (you and me) have demanded bigger, heavier, and faster vehicles. If we want to see better fuel economy, we may have to give up any further increase in performance, or even thinking about downsizing and/or downweighting our vehicles.
P.S.: Chart of the Month Archive is available on the right hand column.


